The Body Mass Index and Your Health


In the 1830s, Belgian statistician Adolphe Quetelet set out to quantify the average man. One result of his endeavors became known as the body mass index or the average weight of a human for their height. Since his definition, the body mass index(or BMI) has scarcely changed, and being too far above or below the average is considered a basic measure of poor health.
The BMI varies by gender and bone size, however, the graph below can help you quickly guage your BMI and if you have a healthy weight.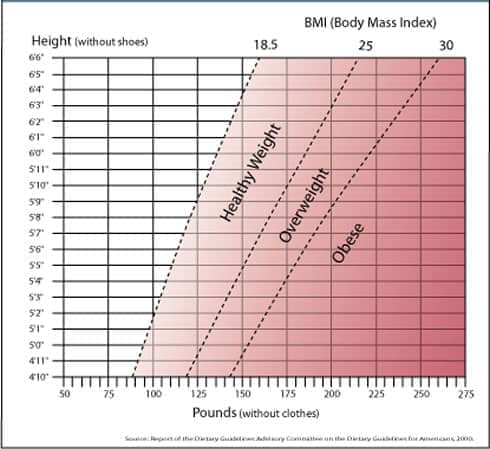
To use the graph, find your weight in pounds on the bottom and follow the line up to your height. Where the two intersect is your BMI.
To get a more exact number you can use the BMI calculator, or you can use this table:
| BMI (kg/m(2)) | 19 | 20 | 21 | 22 | 23 | 24 | 25 | 26 | 27 | 28 | 29 | 30 | 35 | 40 |
| Height (in.) | Weight (lb.) | |||||||||||||
| 58 | 91 | 96 | 100 | 105 | 110 | 115 | 119 | 124 | 129 | 134 | 138 | 143 | 167 | 191 |
| 59 | 94 | 99 | 104 | 109 | 114 | 119 | 124 | 128 | 133 | 138 | 143 | 148 | 173 | 198 |
| 60 | 97 | 102 | 107 | 112 | 118 | 123 | 128 | 133 | 138 | 143 | 148 | 153 | 179 | 204 |
| 61 | 100 | 106 | 111 | 116 | 122 | 127 | 132 | 137 | 143 | 148 | 153 | 158 | 185 | 211 |
| 62 | 104 | 109 | 115 | 120 | 126 | 131 | 136 | 142 | 147 | 153 | 158 | 164 | 191 | 218 |
| 63 | 107 | 113 | 118 | 124 | 130 | 135 | 141 | 146 | 152 | 158 | 163 | 169 | 197 | 225 |
| 64 | 110 | 116 | 122 | 128 | 134 | 140 | 145 | 151 | 157 | 163 | 169 | 174 | 204 | 232 |
| 65 | 114 | 120 | 126 | 132 | 138 | 144 | 150 | 156 | 162 | 168 | 174 | 180 | 210 | 240 |
| 66 | 118 | 124 | 130 | 136 | 142 | 148 | 155 | 161 | 167 | 173 | 179 | 186 | 216 | 247 |
| 67 | 121 | 127 | 134 | 140 | 146 | 153 | 159 | 166 | 172 | 178 | 185 | 191 | 223 | 255 |
| 68 | 125 | 131 | 138 | 144 | 151 | 158 | 164 | 171 | 177 | 184 | 190 | 197 | 230 | 262 |
| 69 | 128 | 135 | 142 | 149 | 155 | 162 | 169 | 176 | 182 | 189 | 196 | 203 | 236 | 270 |
| 70 | 132 | 139 | 146 | 153 | 160 | 167 | 174 | 181 | 188 | 195 | 202 | 207 | 243 | 278 |
| 71 | 136 | 143 | 150 | 157 | 165 | 172 | 179 | 186 | 193 | 200 | 208 | 215 | 250 | 286 |
| 72 | 140 | 147 | 154 | 162 | 169 | 177 | 184 | 191 | 199 | 206 | 213 | 221 | 258 | 294 |
| 73 | 144 | 151 | 159 | 166 | 174 | 182 | 189 | 197 | 204 | 212 | 219 | 227 | 265 | 302 |
| 74 | 148 | 155 | 163 | 171 | 179 | 186 | 194 | 202 | 210 | 218 | 225 | 233 | 272 | 311 |
| 75 | 152 | 160 | 168 | 176 | 184 | 192 | 200 | 208 | 216 | 224 | 232 | 240 | 279 | 319 |
| 76 | 156 | 164 | 172 | 180 | 189 | 197 | 205 | 213 | 221 | 230 | 238 | 246 | 287 | 328 |
- A BMI below 18 is underweight.
- A BMI from 18 up to 25 refers to a healthy weight.
- A BMI from 25 up to 30 is overweight.
- A BMI 30 or higher is obesity.
Body fat, waist size, muscle mass, and the BMI
The BMI is purely a ratio of height and weight, and thus some people criticize it as being an inaccurate health assessment. This can be true if you are an athlete with large amounts of muscle mass but not body fat. To mitigate this problem, waist circumference is often considered when assessing overall health with the BMI.
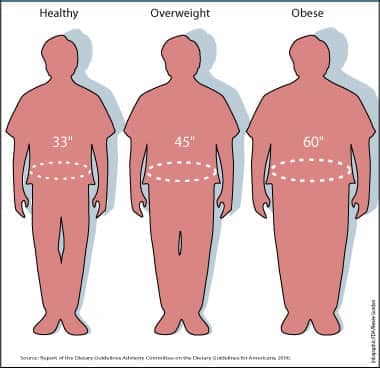
Epidemiological studies show that waist size is correlated with the development of future health problems, leading to the claim that fat on the thighs and hips is relatively healthy.(2) The table below gives a rule of thumb guide to possible health risks as a function of both waist size and BMI.
Risk of Associated Disease According to BMI and Waist Size | |||
| BMI | Waist less than or equal to 40 in. (men) or 35 in. (women) | Waist greater than 40 in. (men) or 35 in. (women) | |
| 18.5 or less | Underweight | -- | N/A |
| 18.5 - 24.9 | Normal | -- | N/A |
| 25.0 - 29.9 | Overweight | Increased | High |
| 30.0 - 34.9 | Obese | High | Very High |
| 35.0 - 39.9 | Obese | Very High | Very High |
| 40 or greater | Extremely Obese | Extremely High | Extremely High |
Related
Data Sources and References
- Garabed Eknoyan (2008). "Adolphe Quetelet (1796-1874) - the average man and indices of obesity". In: Nephrol. Dial. Transplant. 23 (1): 47-51.
Try the recipe nutrition calculator, or daily meal planner.
Create a free account to log and track foods.